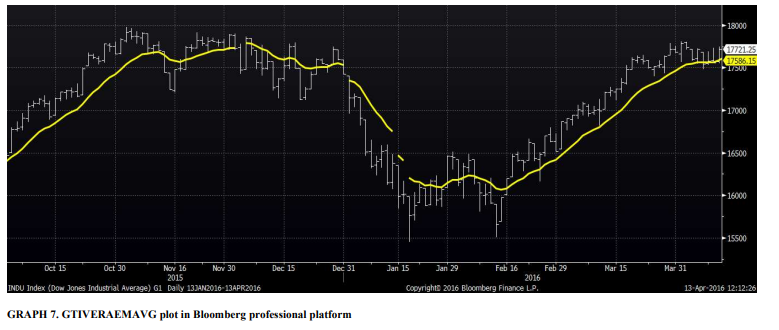
An “explosion moment” is a large movement in the market that can be caused by fundamental changes or the normal dynamic of some assets.These movements can be difficult to navigate and can lead to poor investment decisions. There are two types of events that can cause explosion moments: predictable events, such as macroeconomic data and corporate events, and unpredictable events, such as unexpected global economic events or natural disasters. Technical indicators can help investors to predict and manage these explosion moments, but they are not always accurate and can be affected by noise, such as overnight gaps or futures contract expiration dates. It is important for investors to be aware of the potential sources of volatility and have a plan in place for managing their investments in such situations. There are various strategies that investors can use to mitigate the impact of explosion moments, here I can expose a new way to mitigate this volatility risk.
The Volatility Explosion Relative Adjusted (VERA) theory
Original version: January 2016
Updated on Dec 2022
By: Agustin Vera Torres
ABOUT AUTHOR: CREATOR QUANTVESTOR®, Professional in Business Administration, with a Postgraduate Degree in Applied Mathematics, as an operator of Fixed and Variable Income and currencies. Experience of more than 20 years in the financial sector. Creator of the V.E.R.A theory, base of the indicators.
The Volatility Explosion Relative Adjusted (VERA) theory, aims to address the difficulties that investors face when making decisions following large movements in the market, known as “explosion moments.”
These moments can have significant impacts on the performance of investments and can be difficult to navigate, as they can be caused by a variety of unpredictable factors such as unexpected global economic events or natural disasters.
There are two main types of events that can cause explosion moments: predictable events and unpredictable events. Predictable events include macroeconomic data releases, economic calendar events, and corporate events, while unpredictable events include unexpected global economic events, natural disasters, terrorist attacks, and other unexpected changes.
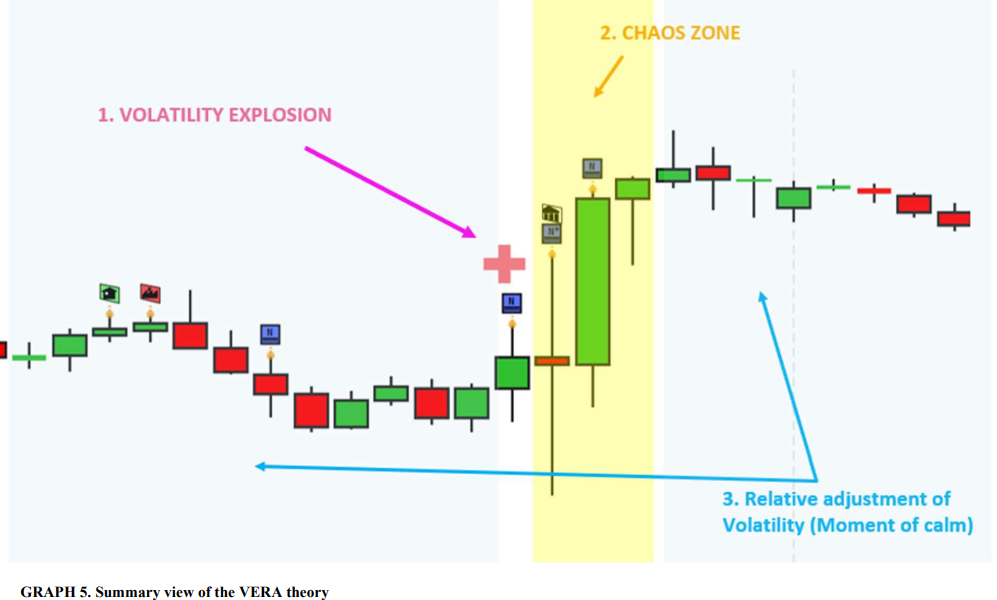
The VERA theory identifies tree phases that occur during an explosion moment: volatility explosion, Chaos zone, and Relative adjustment of Volatility (Moment of calm).
c. Macroeconomic data, economic calendar, and corporative events:
Macroeconomic data releases, such as GDP growth rate, employment data, and inflation data, provide important information about the health and performance of an economy. These data releases can have a significant impact on financial markets, as changes in economic indicators can affect the demand and supply of financial assets.
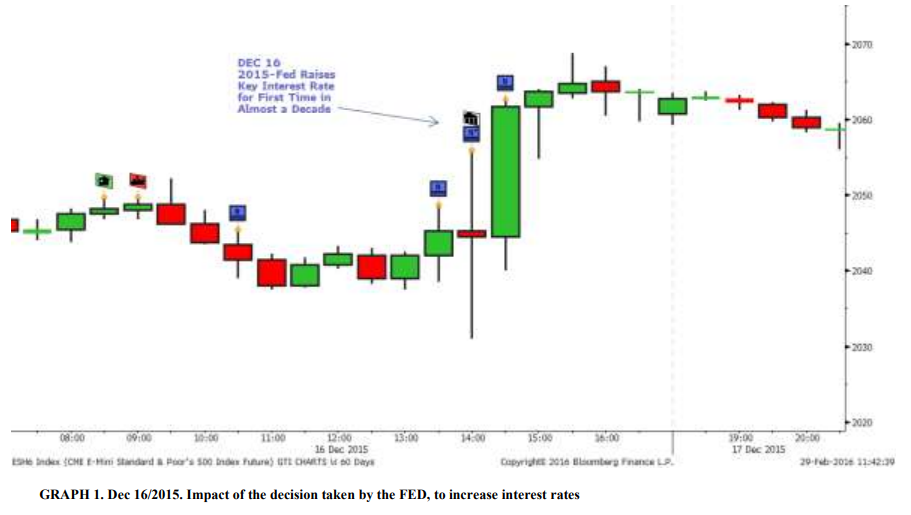
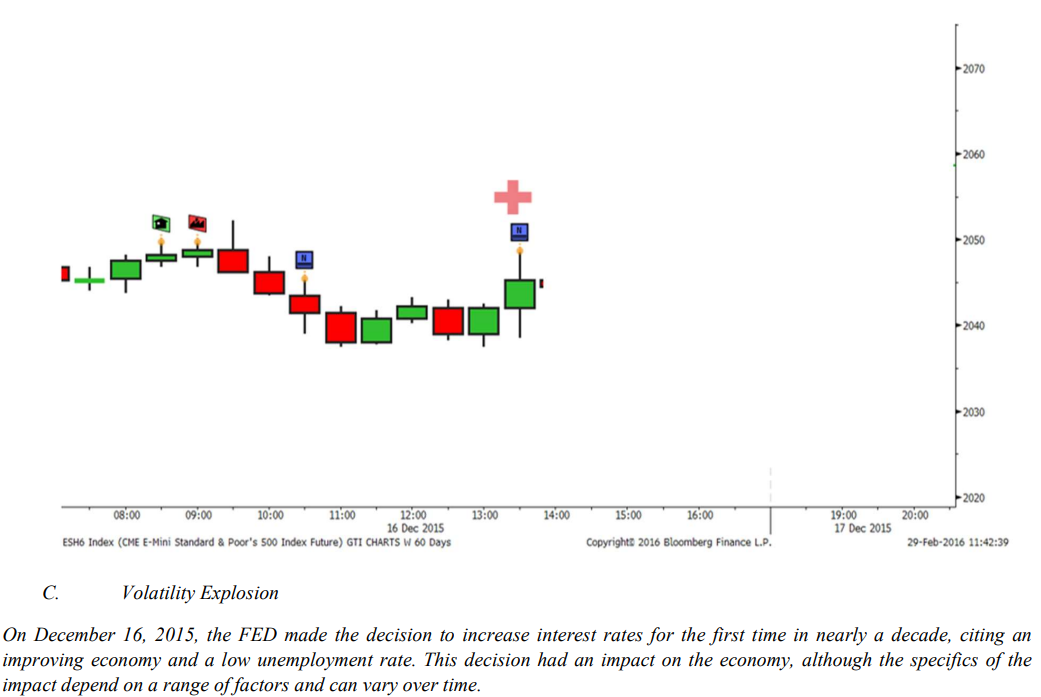
On December 16, 2015, the Fed announced that it would be increasing its benchmark interest rate by 0.25 percentage points, the first time it had done so since 2006. This decision was seen as a sign that the Fed believed that the U.S. economy was strong enough to withstand higher borrowing costs.
At the time of the decision, the U.S. economy had been growing for several years, and the unemployment rate was at a relatively low level. However, there were also concerns about the potential for rising inflation, and the Fed’s decision to increase interest rates was seen to help keep inflation under control. The decision was also seen as a sign that the Fed was confident in the strength of the U.S. economy, and that it believed that the recovery was on a solid footing.
For example, if a country’s GDP growth rate is higher than expected, it may indicate a strong and expanding economy, which can lead to an increase in demand for the country’s assets and a appreciation of its currency. On the other hand, if GDP growth is lower than expected, it may indicate a slowing economy, which can lead to a decrease in demand for the country’s assets and a depreciation of its currency.
Corporate events, such as earnings announcements and shareholder meetings, can also have an impact on financial markets. These events provide important information about a company’s financial performance and can indicate potential changes in its business strategy and outlook. For example, if a company announces strong earnings, it may lead to an increase in demand for its stock, while weak earnings or negative news may lead to a decrease in demand.
From the perspective of the VERA theory, the impact of macroeconomic data releases and corporate events on financial markets is largely driven by the relative adjustment of volatility. In other words, these events can affect the perceived risk and uncertainty surrounding financial assets, which can in turn influence the demand and supply of those assets.
For example, if a company announces unexpectedly strong earnings, it may lead to a decrease in the perceived risk associated with its stock, resulting in an increase in demand and a appreciation in its price.
On the other hand, if a company announces weak earnings or negative news, it may lead to an increase in the perceived risk associated with its stock, resulting in a decrease in demand and a depreciation in its price.
The same principle applies to macroeconomic data releases. If economic indicators such as GDP growth or employment data are stronger than expected, it may lead to a decrease in the perceived risk associated with the country’s assets and a appreciation in their prices. Conversely, if economic indicators are weaker than expected, it may lead to an increase in the perceived risk associated with the country’s assets and a depreciation in their prices. In conclusion, the VERA theory suggests that market movements are largely driven by the relative adjustment of volatility, which can be influenced by macroeconomic data releases and corporate events. By staying informed about these events and understanding how they can affect the perceived risk and uncertainty surrounding financial assets, investors can make more informed investment decisions.
It’s worth noting that the impact of macroeconomic data releases and corporate events on financial markets can vary depending on the context and the specific circumstances surrounding the event. For example, the impact of a GDP growth rate that is slightly lower than expected may be different in a country with a strong economy compared to a country with a weak economy.
In addition, the impact of these events can be influenced by other factors, such as the overall market sentiment, the current economic environment, and the perceived risks and uncertainties in the market. For example, if the market is already experiencing a high level of volatility due to other factors, the impact of a macroeconomic data release or corporate event may be less pronounced.
It’s also important to consider the longer-term implications of these events, rather than focusing solely on the short-term market reaction. For example, while a strong earnings announcement may lead to a shortterm appreciation in a company’s stock price, the long-term prospects of the company may be more
important for investors.
Overall, it’s important for investors to consider the full context and implications of macroeconomic data releases and corporate events when making investment decisions. By staying informed about these events and understanding how they can affect the perceived risk and uncertainty surrounding financial assets,
investors can better manage their investments and make more informed investment decisions.
One of the key challenges for investors when it comes to macroeconomic data releases and corporate events is staying informed about these events and understanding their potential impact on financial markets. There are a few different approaches that investors can take to stay informed and make more informed investment decisions:
Use economic calendars: Economic calendars provide a schedule of upcoming macroeconomic data releases and corporate events. By keeping track of these events, investors can better prepare for their potential impact on financial markets.
Follow financial news: Financial news outlets and websites can provide up-to-date information about macroeconomic data releases and corporate events, as well as analysis and commentary on their potential impact on financial markets. By following these sources, investors can stay informed about key events and developments.
Use financial tools and resources: There are a variety of financial tools and resources available to investors, such as stock market apps, financial news aggregators, and data analytics platforms, which can help investors stay informed about macroeconomic data releases and corporate events. By using these approaches, investors can better stay informed about key events and developments and make more informed investment decisions. It’s important to remember that while macroeconomic data releases
and corporate events can have a significant impact on financial markets, they are just one factor among many that can influence market movements. Investors should consider a wide range of factors when making investment decisions, including the overall economic environment, market sentiment, and their own risk tolerance and investment objectives. In addition to staying informed about macroeconomic data releases and corporate events, investors can also use risk management techniques to protect their investments and minimize the impact of market volatility.
Some common risk management techniques include:
Diversification: By diversifying their portfolio across a range of asset classes, investors can reduce the risk
of any one asset or event having a significant impact on their overall investment performance.
Use stop-loss orders: Stop-loss orders allow investors to set a predetermined price at which a position will be closed, protecting against potential losses if the market moves against them.
Use position sizing: Position sizing involves adjusting the size of an investment position based on the level of risk and potential reward. By carefully managing position sizes, investors can better manage their risk exposure.
Use hedging strategies: Hedging strategies involve using financial instruments, such as options or futures contracts, to offset the risk of potential losses in an investment position. By using risk management techniques, investors can better protect their investments and minimize the impact of market volatility. It’s important to remember that no risk management technique is foolproof and that all investments carry some level of risk. Investors should carefully consider their own risk tolerance and investment objectives before implementing any risk management strategy.
In summary, macroeconomic data releases and corporate events can have a significant impact on financial markets, as they provide important information about the health and performance of an economy or a company. These events can often lead to increased volatility in financial markets, as changes in demand and supply for financial assets can cause significant price movements.
The VERA theory suggests that market movements are driven by the relative adjustment of volatility, which can be influenced by macroeconomic data releases and corporate events. By staying informed about these events and understanding how they can affect the perceived risk and uncertainty surrounding financial assets, investors can make more informed investment decisions.
Investors can use a variety of approaches to stay informed about macroeconomic data releases and corporate events, including using economic calendars, following financial news, and using financial tools and resources. In addition, investors can use risk management techniques, such as diversification, stop-loss orders, position sizing, and hedging strategies, to protect their investments and minimize the impact of market volatility.
Overall, staying informed about macroeconomic data releases and corporate events and using risk management techniques can help investors better manage their investments and make more informed investment decisions.
There are a few additional points to consider when it comes to the impact of macroeconomic data releases and corporate events on financial markets:
Timing: The timing of macroeconomic data releases and corporate events can be important in terms of their impact on financial markets. For example, an earnings announcement before the market open may have a different impact than an earnings announcement after the market close.
Market expectations: The market’s expectations for a macroeconomic data release or corporate event can also influence its impact on financial markets. If the actual result is in line with market expectations, the impact may be less pronounced, while if the result is significantly different from expectations, it may have a greater impact.
Market context: The overall market context can also influence the impact of macroeconomic data releases and corporate events on financial markets. For example, if the market is already experiencing a high level of volatility due to other factors, the impact of a macroeconomic data release or corporate event may be less pronounced.
Multiple events: It’s also worth noting that financial markets can be influenced by multiple events occurring at the same time. For example, an earnings announcement by a major company may coincide with the release of important economic data, which can both impact the market simultaneously.
By considering these factors, investors can better understand the potential impact of macroeconomic data releases and corporate events on financial markets and make more informed investment decisions.
Here are a few historical examples of how macroeconomic data releases and corporate events have impacted financial markets:
US Non-Farm Payrolls report: The monthly Non-Farm Payrolls report, which provides data on employment in the United States, is a closely watched economic indicator. In March 2020, the release of the Non-Farm Payrolls report showed that the US economy had lost 701,000 jobs, which was much worse than expected. This news led to a significant sell-off in financial markets, as investors were concerned aboutthe impact of the COVID-19 pandemic on the economy.Apple earnings announcement: In July 2020, tech giant Apple announced better-than-expected earnings for the quarter, leading to a significant increase in the company’s stock price. The strong earnings were driven by strong demand for the company’s products, particularly its iPhone, which helped to boost investor sentiment.
– Brexit vote: In June 2016, the United Kingdom voted to leave the European Union, a decision that was widely unexpected and had a significant impact on financial markets. The vote led to a drop inthe value of the British pound and a sell-off in global financial markets, as investors were concerned about the economic implications of the UK’s exit from the EU.
These examples illustrate the potential impact of macroeconomic data releases and corporate events on financial markets. By staying informed about these events and understanding their potential impact on financial assets, investors can make more informed investment decisions.It’s important to remember that the impact of macroeconomic data releases and corporate events on financial markets can vary significantly depending on the specific circumstances surrounding the event. In some cases, an event that is widely expected to have a significant impact on financial markets may have a relatively muted response, while an event that is not widely anticipated may have a much larger impact. For example, if a company announces weak earnings that are in line with market expectations, the impact on the company’s stock price may be relatively small. On the other hand, if the company announces strong earnings that exceed market expectations, the stock price may experience a significant increase. Similarly, if a macroeconomic data release is in line with market expectations, the impact on financial markets may be relatively small, while if the data is significantly different from expectations, it may have a larger impact. Overall, it’s important for investors to consider the full context and implications of macroeconomic data releases and corporate events when making investment decisions. By staying informed about these events and understanding how they can affect the perceived risk and uncertainty surrounding financial assets, investors can better manage their investments and make more informed investment decisions.
There are a few additional points to consider when it comes to the impact of macroeconomic data releases and corporate events on financial markets:
Market participants: The market participants who are most likely to be impacted by macroeconomic data releases and corporate events include traders, investors, and speculators. Traders may be more focused on short-term price movements and may be more reactive to news and events, while investors may be more focused on the longer-term prospects of an asset and may be less affected by short-term market movements.Speculators may be more focused on taking advantage of market volatility and may be more reactive to news and events.
Market sentiment: Market sentiment, which refers to the overall mood or attitude of the market, can also influence the impact of macroeconomic data releases and corporate events. For example, if the market is experiencing a high level of risk aversion, a negative event may have a greater impact on financial markets, while if the market is experiencing a high level of risk appetite, a positive event may have a greater impact.
Market structure: The overall market structure can also influence the impact of macroeconomic data releases and corporate events. For example, if a market is highly liquid and has a large number of participants, the impact of an event may be more muted, while if a market is less liquid and has fewer participants, the impact may be more pronounced. By considering these factors, investors can better understand the potential impact of macroeconomic data releases and corporate events on financial markets and make more informed investment decisions.
b. Gaps Overnight:
Overnight gaps, also known as opening gaps, are the difference between the closing price of a financial asset on one day and its opening price on the next. The concept of overnight gaps is closely related to the Volatility Explosion Relative Adjusted (VERA) theory, which suggests that financial market behavior can be influenced by economic, political, and social factors that can change the demand and supply of an asset, resulting in gaps between the closing and opening prices.
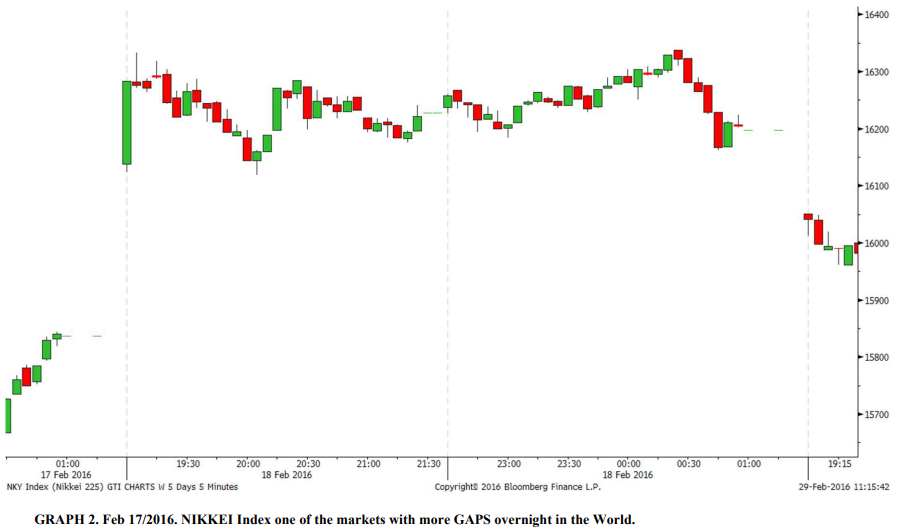
The NIKKEI Index is a stock market index for the Tokyo Stock Exchange (TSE) in Japan. It is a priceweighted index that is calculated by taking the average of the prices of the 225 most highly capitalized companies listed on the TSE. The NIKKEI Index is one of the most widely followed stock market indices in Asia and is often used as a benchmark for the performance of the Japanese stock market.
A “gap” in a stock market index occurs when there is a significant difference between the closing price of an index on one day and the opening price on the following day. This can be caused by a variety of factors, such as significant news events or changes in market sentiment. The NIKKEI Index is known for having a high number of gaps, particularly overnight gaps, which can be caused by news or events that occur after the market closes but before it opens the following day. It is not uncommon for the NIKKEI Index to experience significant overnight gaps, and this can have a significant impact on the index’s performance.
There are a variety of factors that can cause overnight gaps, including global events, economic data releases, and corporate news that occur after the market has closed. For example, if a company announces strong earnings after the market has closed, it may lead to an increase in demand for its stock and a gap up in the opening price. On the other hand, if the company announces weak earnings or negative news, it may lead to a decrease in demand for its stock and a gap down in the opening price. In addition to corporate news, overnight gaps can also be influenced by macroeconomic events such as changes in monetary policy or political events that occur while the market is closed. For example, a surprise interest rate hike by a central bank may lead to a gap up in the opening price of its currency, while a surpriserate cut may lead to a gap down. It is important for investors to be aware of the possibility of overnight gaps and to have a plan in place to manage the risks associated with them. This may involve diversifying investments, using stop-loss orders, or adjusting position sizes to reduce exposure to risk. Additionally, investors can use risk management techniques such as stop-loss orders or position sizing to protect their investments.
Historical examples of overnight gaps include the “flash crash” of 2010, when the Dow Jones Industrial Average fell over 1,000 points in a matter of minutes, and the “Black Monday” crash of 1987, when the Dow Jones Industrial Average fell 22.6% in a single day. Both of these events were caused by a combination of market forces and investor panic, leading to significant gaps between the closing and opening prices of securities.
To minimize the impact of overnight gaps, investors can follow a few recommendations:
-
Stay informed: Keep track of market-moving events and news that may affect the demand and supply of your investments.
Use risk management techniques: Implement strategies such as stop-loss orders or position sizing to protect your investments from unexpected price movements.
Diversify your portfolio: Spread your investments across a range of asset classes and sectors to mitigate the risk of overnight gaps in any one particular market.
Have a plan in place: Know how you will respond to overnight gaps and be prepared to implement your plan if necessary.
Keep an eye on the news: Overnight gaps can often be caused by news or events that occur after the market has closed. Be sure to stay up-to-date on the latest headlines and be prepared for the potential impact on your investments.
Monitor your positions: It’s important to regularly check on your positions, especially during times of increased volatility or when significant market-moving events are expected.
Consider using limit orders: If you’re concerned about the potential for overnight gaps, you may want to consider using limit orders rather than market orders. A limit order allows you to specify the maximum or minimum price at which you are willing to buy or sell a security, which can help you to minimize the impact
of overnight gaps.
Understand the risks: As with any investment, it’s important to be aware of the risks involved. Overnight gaps can be particularly risky for traders who hold positions overnight, as they may be subject to significant price moves when the market reopens. Be sure to carefully consider the risks and determine if overnight gap trading is appropriate for your investment strategy. Don’t let emotions rule your decisions: It can be tempting to make impulsive decisions when faced with unexpected price moves, but it’s important to remain calm and stick to your investment plan.
Use a stop-loss order: A stop-loss order is an order that is placed with a broker to sell a security when it reaches a certain price. This can be a useful tool for managing risk, as it allows you to set a predetermined price at which you are willing to sell if the security’s price moves against you.
Consider using a trailing stop-loss order: A trailing stop-loss order is a type of stop-loss order that adjusts automatically as the security’s price moves in favor of your position. For example, if you have a long position in a security and the price rises, your trailing stop-loss order will adjust upward to lock in some of your profits. This can be a useful way to manage risk, as it allows you to protect your profits while still giving you the opportunity to potentially earn more.
Be aware of the impact of liquidity: Overnight gaps can be more pronounced in markets that have low liquidity, as there may be fewer buyers and sellers to absorb the impact of any news or events. Keep this in mind when considering investments, as low liquidity can make it more difficult to exit a position if needed.
Don’t over-leverage: It can be tempting to use leverage to amplify your returns, but it’s important to be aware of the risks involved. Leverage magnifies both your potential profits and potential losses, so it’s important to use it carefully and not over-leverage your positions. By keeping these points in mind, investors can better navigate the potential risks and opportunities presented by overnight gaps in the market. It’s always important to do your own research and consider the specific characteristics and risks of any investment before taking a decision.
c. Futures contracts due dates (Rollover):
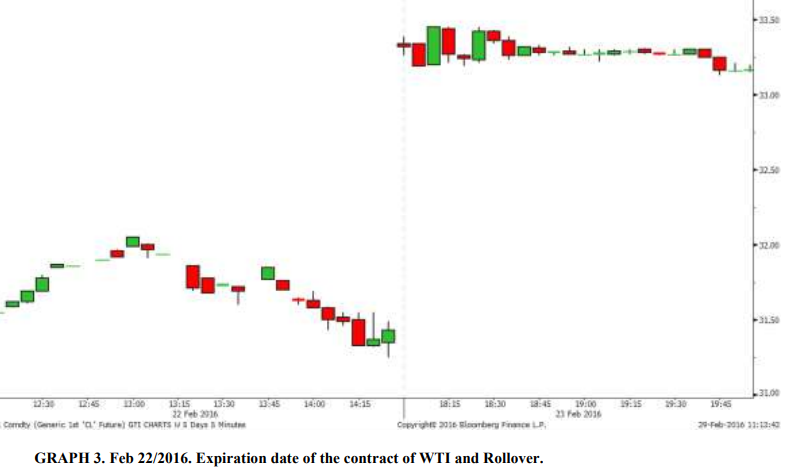
The expiration of futures contracts and the rollover process are important considerations for investors in the futures market. In this market, contracts have a specific expiration date, after which they must be settled or closed out. This means that at the expiration date, the buyer of the contract must take delivery of the underlying asset, or the seller must deliver the underlying asset, depending on the terms of the contract. To avoid having to take or make delivery of the underlying asset, traders and investors often engage in a process called rollover, where they close out their existing futures contract and enter into a new contract with a later expiration date. This allows them to continue holding a futures position without having to take delivery of the underlying asset.
The rollover process can have an impact on the prices of futures contracts and the overall market. For example, if there is many traders rolling over their positions from one contract to another, it can lead to increased demand for the new contract and a corresponding increase in its price. On the other hand, if there is a lack of demand for a particular contract, it may lead to a decrease in its price.
In addition to the rollover process, the expiration of futures contracts can also lead to gaps in the prices of the underlying asset. This is because the bid-offer spread, or the difference between the highest price that a buyer is willing to pay and the lowest price that a seller is willing to accept, may be wider for contracts with later expiration dates. As a result, the prices of the underlying asset may gap higher or lower at the expiration of a contract, depending on the supply and demand for the contract.
The concept of the rollover process and expiration of futures contracts is closely related to the Volatility Explosion Relative Adjusted (VERA) theory, which suggests that financial market behavior can be influenced by economic, political, and social factors that can change the demand and supply of an asset, resulting in price movements. The rollover process and expiration of futures contracts can be considered a demand and supply event, as traders and investors enter new contracts or take delivery of the underlying asset.
To minimize the impact of the rollover process and expiration of futures contracts, investors can follow a few recommendations:
Stay informed: Keep track of the expiration dates of your futures contracts and be aware of the potential impact on the prices of the underlying assets.
Have a plan in place: Know how you will respond to the expiration of your futures contracts and be prepared to implement your plan if necessary.
Historical examples of the impact of the rollover process and expiration of futures contracts include the “flash crash” of 2010, when the Dow Jones Industrial Average fell over 1,000 points in a matter of minutes, and the “Black Monday” crash of 1987, when the Dow Jones Industrial Average fell 22.6% in a single day. In both of these events, the expiration of futures contracts and the rollover process may have contributed to the significant price movements that occurred.
To better understand the potential impact of the rollover process and expiration of futures contracts, it’s important to consider the VERA theory and its suggestion that financial market behavior can be influenced by economic, political, and social factors that can change the demand and supply of an asset. This can help investors to anticipate and prepare for potential market-moving events, such as the expiration of futures contracts and the rollover process.
d. Unexpected global economic events, natural disasters, terrorist attacks, macroeconomic unexpected changes, unusual flows, or credit rating modifications
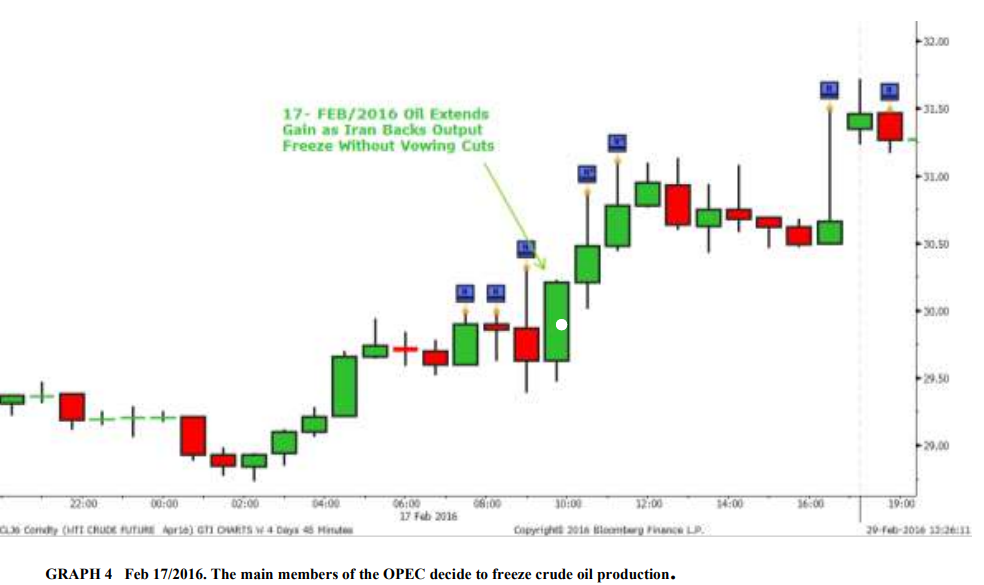
Unexpected global economic events, natural disasters, terrorist attacks, and other unexpected changes in the macroeconomic environment can have a significant impact on financial markets and can be difficult to predict. These types of events can lead to sudden changes in demand and supply, resulting in price movements and an increase in volatility. For example, On February 17, 2016, the Organization of the Petroleum Exporting Countries (OPEC) announced that it had reached an agreement to freeze crude oil production at current levels. The decision was seen as a surprise by many, as OPEC has traditionally been resistant to production cuts. The move was seen as an attempt to stabilize global oil prices, which had been in decline for several months due to oversupply and sluggish demand. The decision was also seen as a sign of shifting power dynamics within OPEC, as some of the organization’s smaller, more financially strapped members, such as Venezuela and Ecuador, pushed for the production freeze. The production freeze agreement was not a formal binding pact, and some OPEC members, such as Iran, did not agree to the terms.
Other sample was that on January 15, 2015, the Central Bank of Switzerland made the surprise decision to abandon its policy of pegging the value of the Swiss franc to the euro. The bank had been maintaining the peg for several years to stabilize the franc and protect the country’s export-dependent economy. The decision to abandon the peg was seen as a response to the European Central Bank’s decision to embark on a program of quantitative easing, which was expected to lead to a depreciation of the euro. The move by the Central Bank of Switzerland led to a sudden and dramatic appreciation of the franc against the euro and other currencies. This caused significant volatility in financial markets and resulted in significant losses for some market participants who were unprepared for the sudden shift in the currency’s value. The decision by the Central Bank of Switzerland had far-reaching implications for the country’s economy and its relationship with the European Union.
PHASES
C. Volatility Explosion
The volatility explosion, as described in the VERA theory, is a sudden and drastic change in market patterns that is characterized by a 5% error in the analysis of “value at risk,” which is a measure of the risk of loss on an investment. This phase is often difficult to predict and can be a warning sign for traders to implement stop loss measures or close positions on assets experiencing a volatility explosion. The volatility explosion can have significant consequences for market participants, as it can lead to increased uncertainty and risk, and can affect the value of assets and portfolios. It is important for traders and investors to be aware of the potential for a volatility explosion and to have strategies in place to mitigate the potential impacts on their investments.
One way to prepare for a volatility explosion is to diversify investment portfolios and to regularly review and assess risk exposures. This can help to reduce the impact of a volatility explosion on a portfolio and can provide a measure of protection against losses. In addition, it may be advisable to use risk management tools, such as stop loss orders, to limit potential losses on positions that may be vulnerable to a volatility explosion.
Another approach to managing the risks associated with a volatility explosion is to actively monitor market conditions and to be proactive in making investment decisions. This can involve conducting thorough research and analysis to identify potential risks and opportunities in the market and making informed decisions about where to allocate capital. It is also important to be aware of the potential psychological impacts of a volatility explosion on decision-making. In times of increased uncertainty and stress, it is common for traders and investors to experience cognitive biases and emotions that can affect their judgment. Being mindful of these potential psychological impacts and taking steps to manage them can help to improve decision-making in volatile market conditions.
Overall, the volatility explosion is a significant event in financial markets that can have significant consequences for market participants. It is important for traders and investors to be aware of the potential for a volatility explosion and to have strategies in place to mitigate the potential impacts on their investments.
In addition to implementing appropriate risk management strategies, it’s important for investors to be aware of the potential impact of these events on the VERA theory, which suggests that financial market behavior can be influenced by economic, political, and social factors that can change the demand and supply of an asset. By understanding the potential impact of unpredictable events on the demand and supply of an asset, investors can be better prepared for the potential impact on their investments.
Another important factor for investors to consider when managing the risks associated with unexpected events is the use of fundamental and technical analysis. Fundamental analysis involves analyzing the underlying factors that drive the value of an asset, such as the financial health of a company or the economic conditions of a country. By using fundamental analysis, investors can get a better understanding of the longterm prospects of an asset and make more informed decisions about how to respond to unexpected events. Technical analysis, on the other hand, involves analyzing historical price data, as well as other data such as trading volume, to identify patterns and trends that may indicate where the price of an asset is likely to go next. By using technical analysis, investors can get a better understanding of the forces driving the demand and supply of an asset and make more informed decisions about how to respond to unexpected events.
Investors may want to consider using a combination of technical and fundamental analysis to get a more complete understanding of the potential impact of unexpected events on financial markets. By using both approaches, investors can get a more comprehensive view of the forces driving the demand and supply of an asset and make more informed decisions about how to respond to these events.
b. Chaos zone
The chaos zone, as described in the VERA theory, is the period immediately following a volatility explosion in financial markets. This phase is characterized by increased uncertainty and market panic and is often marked by irrational decision-making and impulsive behavior.
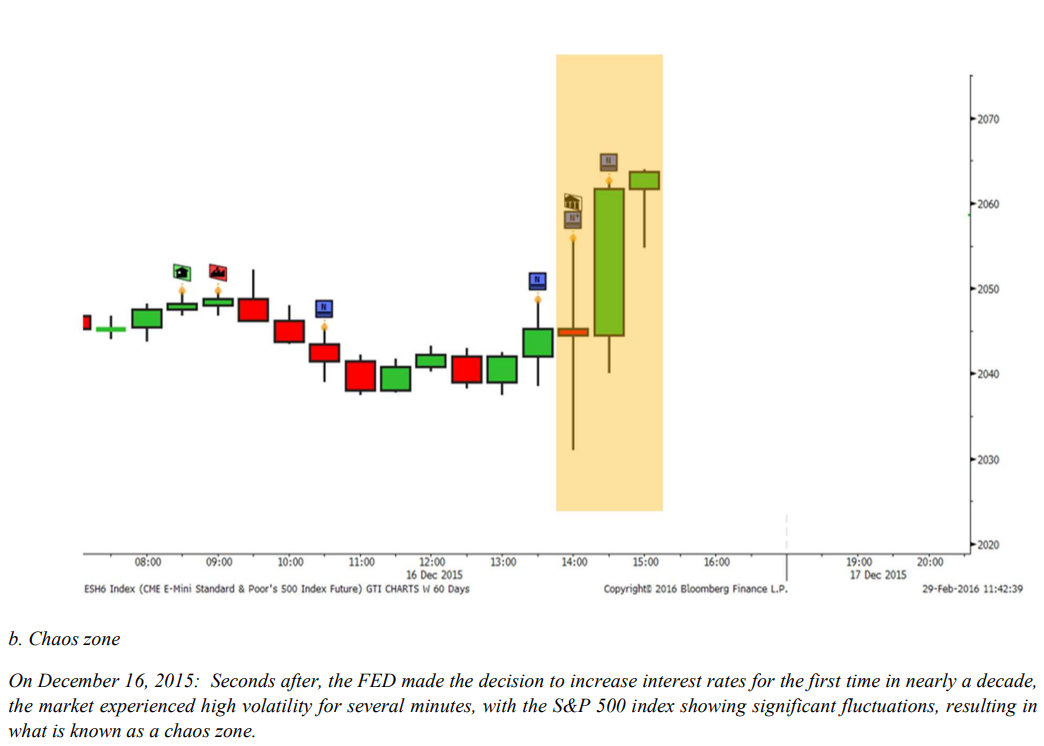
One of the challenges of the chaos zone is determining how long it will last. It is not uncommon for the chaos zone to persist for a period, with some estimates suggesting it can last anywhere from a few minutes to several hours. This can make it difficult for traders and investors to know when it is safe to re-enter the market and resume normal operations.
One way to mitigate the risks associated with the chaos zone is to avoid making investments during this time. It is generally recommended to wait until the market has returned to a more stable state before reentering and resuming normal operations. This can help to reduce the potential for losses and ensure that investment decisions are based on more reliable information and analysis.
Another approach to managing the risks of the chaos zone is to use risk management tools, such as stop loss orders, to limit potential losses on positions that may be vulnerable to market turmoil. It is also advisable to diversify investment portfolios and to regularly review and assess risk exposures to help reduce the impact of market volatility on a portfolio.
Overall, the chaos zone is a challenging phase in financial markets that can be difficult to navigate. It is important for traders and investors to be aware of the potential for market panic and irrational decisionmaking during this time, and to have strategies in place to mitigate the risks and protect their investments.
c. Relative adjustment of Volatility (Moment of calm)
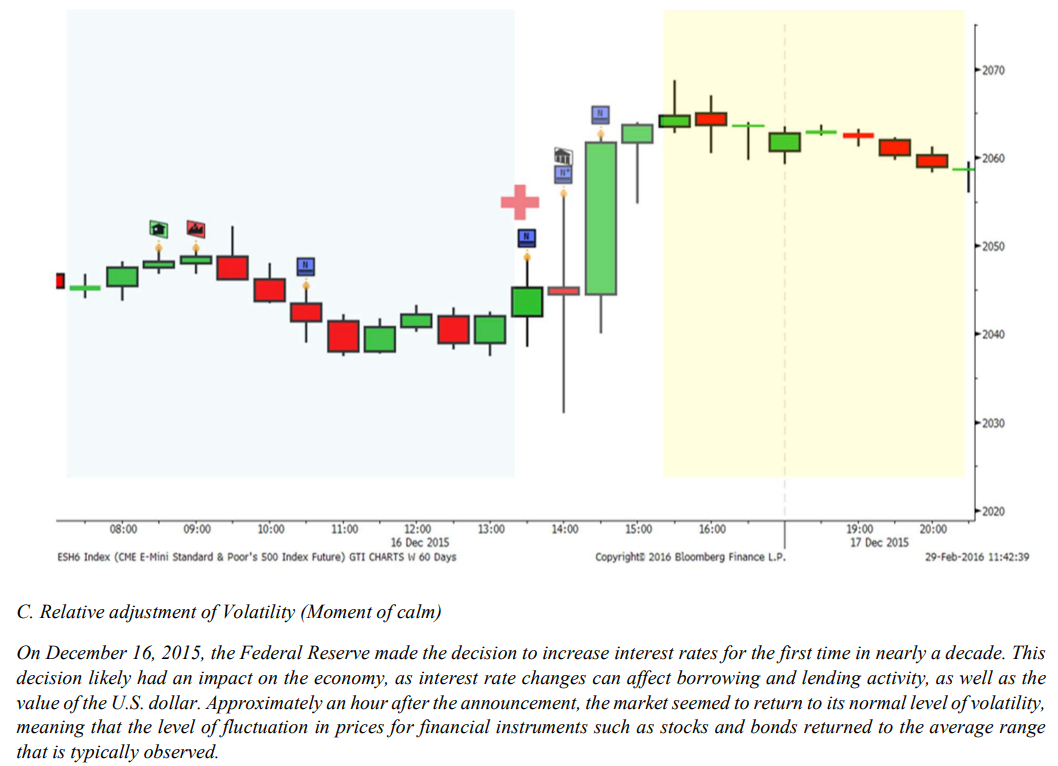
The relative adjustment of volatility, also known as the moment of calm, is the phase in the VERA theory that follows a volatility explosion and the chaos zone. This is the time when the market returns to a more stable state and the risk of loss due to high volatility is lower. During the relative adjustment of volatility phase, it is generally safe to re-enter the market and resume normal operations. This is the time when traders and investors can begin to apply traditional technical analysis techniques and make investment decisions based on more reliable information and analysis
Volatility can still fluctuate during this time and there may be periods of increased risk. However, the risk of loss due to high volatility is generally lower during the relative adjustment of volatility phase compared to the chaos zone.
One way to manage the risks associated with the relative adjustment of volatility phase is to continue using risk management tools, such as stop loss orders, to limit potential losses on positions. It is also advisable to diversify investment portfolios and to regularly review and assess risk exposures to help reduce the impact of market volatility on a portfolio. Another approach to managing risk during the relative adjustment of volatility phase is to actively monitor market conditions and be proactive in making investment decisions.
This can involve conducting thorough research and analysis to identify potential risks and opportunities in the market and making informed decisions about where to allocate capital.
During the chaos zone, it is common for traders and investors to experience cognitive biases and emotions that can affect their judgment. This can lead to decisions that are based on impulse or physiological reactions, rather than logic and reason. As a result, the decisions made during the chaos zone can often have random or unpredictable outcomes.
It Is Important to note that the r”lati’e adjustment of volatility phase is not a guarantee of market stability.
Overall, the relative adjustment of volatility phase is a more stable and less risky time to operate in financial markets, following the volatility explosion and chaos zone. It is important for traders and investors to be aware of the potential for market volatility and to have strategies in place to manage risk and protect their investments.
Intraday indicators incorporate the volatility of prices as the difference, if it exists, between the close level of the previous data before the explosion moment and the beginning of the new one in the moment of calm.
This is known as the “chaos zone”. The “chaos zone” is an area inside the graph in which high volatility happens, out of the ordinary, and can be generated within the negotiation session (intraday) or after it (overnight).
By applying the “chaos zone”, the trader has a more precise tool in comparison to other normal indicators.
The buy and sell signals anticipate to the beginning of the Relative Volatility Adjustment (moment of calm).
Experience has shown that the time between the anticipated signal is received, and the exact time is crucial to obtain profits or not.
The intraday-VERA indicators after the first n quotes, where n is the period, tend to be similar to the traditional intraday indicators. For this reason, the intraday will be above or below, depending on the “CHAOS ZONE”, from the normal level at the beginning of the next period. After the n periods are shown, both will end in the same point. This will happen every time the number of quotes of the day is higher than the indicator periods. The application of the VERA theory to traditional technical indicators can provide traders and investors with a more precise tool for analyzing market conditions and making investment decisions. The VERA theory suggests that financial markets can be divided into three distinct phases: the volatility explosion, the chaos zone, and the relative adjustment of volatility. One of the key applications of the VERA theory is in the use of intraday indicators, which incorporate the volatility of prices as the difference between the close level of the previous data before the volatility explosion and the beginning of the new data in the moment of calm. This period, known as the “chaos zone,” is characterized by high volatility and can occur within the trading session (intraday) or after it (overnight).
By applying the “chaos zone” to traditional technical indicators, traders can anticipate buy and sell signals and take advantage of the relative adjustment of volatility, or moment of calm, to maximize profits.
Experience has shown that the time between the anticipated signal and the exact moment of the relative adjustment of volatility is crucial in determining whether profits are achieved or not. One of the advantages of using intraday-VERA indicators is that they tend to be similar to traditional intraday indicators after the first n quotes, where n is the period. This means that the intraday indicator will be above or below the normal level at the beginning of the next period, depending on the “chaos zone.”
After n periods have been shown, both the intraday-VERA indicator and the traditional intraday indicator will end in the same point. This will happen every time the number of quotes in the day is greater than the indicator periods. Overall, the application of the VERA theory to traditional technical indicators can provide traders and investors with a more effective tool for analyzing market conditions and making informed investment decisions. By incorporating the concept of the “chaos zone” and the relative adjustment of volatility, traders can anticipate buy and sell signals and take advantage of market conditions to maximize profits.
The VERA theory can be applied to a variety of technical indicators, including trend-following indicators,momentum indicators, and oscillators. Trend-following indicators, such as moving averages, are used to identify the overall direction of the market and can be useful in identifying potential buying or selling opportunities
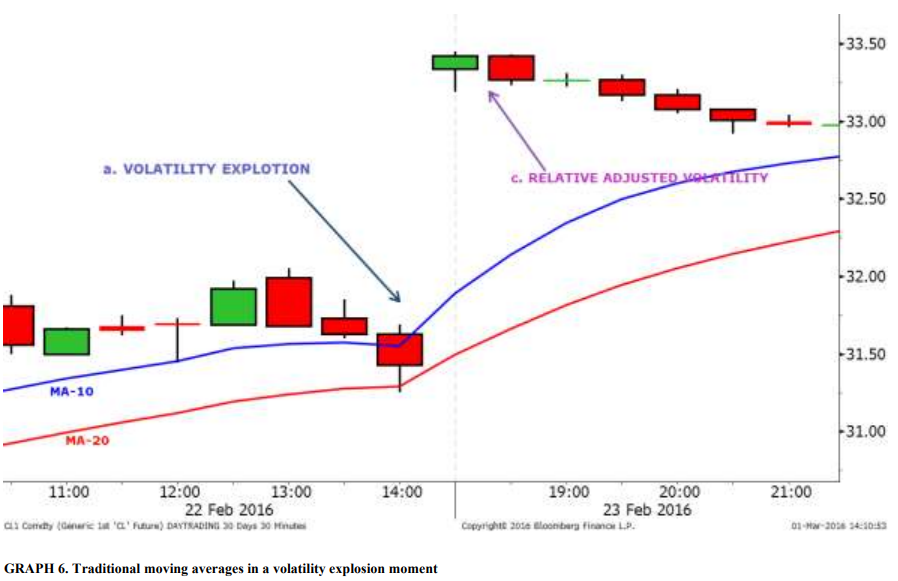
Momentum indicators, such as the relative strength index (RSI), are used to measure the speed and magnitude of price changes and can be helpful in identifying overbought or oversold conditions in the market. Oscillators, such as the stochastic oscillator, are used to identify potential turning points in the market and can be useful in identifying potential entry and exit points for trades. By applying the VERA theory to these technical indicators, traders can gain a better understanding of market conditions and can more accurately anticipate potential trading opportunities. For example, by incorporating the “chaos zone” into trend-following indicators, traders can identify the beginning of the relative adjustment of volatility and look for potential buying opportunities as the market returns to a more stable state. Similarly, by incorporating the “chaos zone” into momentum indicators, traders can identify overbought or oversold conditions in the market and look for potential selling or buying opportunities as the market returns to a more normal state. Oscillators can also be used in conjunction with the VERA theory to identify potential turning points in the market and to identify potential entry and exit points for trades.
In addition to being applied to traditional technical indicators, the VERA theory can also be used in conjunction with other trading strategies and techniques. For example, traders can use the VERA theory to identify potential entry and exit points for trend-following or momentum-based trades. The VERA theory can also be used to identify potential opportunities for arbitrage, or the simultaneous buying and selling of securities in different markets or in different forms in order to take advantage of price discrepancies. By identifying periods of high volatility and the relative adjustment of volatility, traders can identify potential opportunities for arbitrage and take advantage of price differences to generate profits.
Another potential application of the VERA theory is in the use of algorithms for automated trading. By incorporating the concept of the “chaos zone” and the relative adjustment of volatility into trading algorithms, traders can automate their trading strategies and take advantage of market conditions in a more efficient and effective manner.
Overall, the VERA theory has a wide range of applications in the world of trading and investing, and can be used in conjunction with a variety of technical indicators and other trading strategies to help traders and investors make more informed and effective investment decisions.
There are several considerations that traders and investors should keep in mind when applying the VERA theory to their trading and investing activities. One important consideration is the need to be aware of market conditions and to be prepared for periods of increased volatility. Traders and investors should also be aware of the potential psychological impacts of market events, such as the volatility explosion and the chaos zone, and be mindful of the potential for cognitive biases and emotions to affect decision-making. It may be helpful to have strategies in place to manage these psychological impacts and to ensure that investment decisions are based on logic and reason. In addition, traders and investors should be aware of the limitations of the VERA theory and other technical analysis techniques. Technical analysis is based on the assumption that past price and volume trends can provide insight into future market movements, but this is not always the case. It is important to recognize that technical analysis is not a perfect science and that there are many factors that can influence market movements, including economic and political events, market psychology, and investor sentiment. Finally, traders and investors should be aware of the potential risks associated with trading and investing and be prepared to manage those risks through the use of risk management tools and techniques, such as stop loss orders and diversification.
Overall, the VERA theory can be a useful tool for traders and investors looking to analyze market conditions and make informed investment decisions, but it is important to be aware of its limitations and to use it in conjunction with other strategies and techniques to manage risk and achieve long term investment success.
In addition, traders and investors should be aware of the potential impact of market news and events on the asset they are trading. Economic and political events, as well as company-specific news, can all have an impact on asset prices and can influence market movements. It is important for traders and investors to stay informed about these events and to be prepared for the potential impact they may have on the asset they are trading.
Another key factor to consider when applying the VERA theory is the need to have a well-defined trading plan and to stick to it. It can be easy to get caught up in the excitement of trading and to deviate from a predetermined plan, but this can be risky and can lead to poor investment decisions. It is important to have a clear understanding of one’s investment goals and risk tolerance, and to develop a trading plan that is consistent with these goals. Overall, the applic ation of the VERA theory to trading and investing requires a thorough understanding of the underlying asset, an awareness of market news and events, and a welldefined trading plan. By considering these factors and being prepared for periods of increased volatility, traders and investors can more effectively apply the VERA theory to their investment activities and achieve
long-term success.
One of the challenges of applying the VERA theory to trading and investing is the need to accurately identify the beginning of the volatility explosion and the chaos zone. As the VERA theory suggests, the prediction of the moment of explosion is almost impossible, and it can be difficult to determine exactly when the market has entered the chaos zone. One way to address this challenge is to use a variety of technical and fundamental analysis tools to monitor market conditions and to identify potential signs of increased volatility. This can involve using trend-following indicators, such as moving averages, to identify changes in the overall direction of the market, and using momentum indicators, such as the relative strength index (RSI), to identify overbought or oversold conditions. Another approach is to use risk management tools, such as stop loss orders, to limit potential losses on positions. By setting appropriate stop loss levels, traders and investors can protect themselves against sudden market movements and minimize the impact of the chaos zone on their portfolios.
Finally, it can be helpful to have a diversified investment portfolio and to regularly review and assess risk exposures. By diversifying across a range of asset classes and sectors, traders and investors can reduce the impact of market volatility on their portfolios and be better prepared for periods of increased uncertainty.
GTI (Global Trading Indicators) is a technical analysis tool that provides technical indicators for traders and investors. The indicators are based on volatility analysis and are designed to be useful for any timeframe chart, including minute, daily, and other timeframes. GTIndicators use a variety of symbols, such as arrows, diamonds, triangles, and circles, to identify new trends in a friendly and simple way, without the need for complex formulas. One of the key features of GTIndicators is their ability to quickly adapt to market changes and provide efficient signals under market volatility. This is achieved using moving averages thatare adjusted for intraday trading and enable decision making as soon as the market opens or when intraday gaps occur.
In addition to identifying trends, GTIndicators also show changing trends exhaustion, convergences and
divergences, risk areas, trailing stops, key levels, and low-risk entry zones. These features make GTIndicators comprehensive tools that can help traders and investors make informed investment decisions in a variety of market conditions.
GTI VERA EMAVG
The GTI VERA EMAVG study is a technical indicator developed by Global Trading Indicators (GTI) that is based on the VERA theory of volatility analysis. The indicator is designed to be useful for any timeframe
chart, including minute, daily, and other timeframes. It uses a variety of symbols, such as arrows, diamonds, riangles, and circles, to identify new trends in a friendly and simple way, without the need for complex formulas.
One of the key features of the GTI VERA EMAVG study is its ability to quickly adapt to market changes and provide efficient signals under market volatility. It does this by displaying moving averages that are useful in a high volatile market environment. These moving averages are adjusted for intraday trading and enable decision making as soon as the market opens or when intraday gaps occur. In addition to identifying trends, the GTI VERA EMAVG study also shows changing trends exhaustion, convergences and divergences, risk areas, trailing stops, key levels, and low-risk entry zones. It is designed to be a comprehensive tool that can help traders and investors make informed investment decisions in a variety of market conditions. Overall, the GTI VERA EMAVG study is a powerful technical indicator that can be used by traders and investors to analyze market conditions and identify new trends. By incorporating the VERA theory of volatility analysis, the GTI VERA EMAVG study provides a more accurate and effective tool for making investment decisions in a high volatile market environment.
The GTIVERAEMAVG is a custom technical indicator that is designed to provide a more comprehensive view of market conditions and potentially identify trends and reversals. It combines several different technical indicators and calculations, including the Average True Range (ATR) and the VolatRelative variable, to achieve this goal.
Here is implementation of the GTIVERAEMAVG :
First let’s start with a basic calculation:
The arithmetic mean, also known as the mean or average, is a measure of central tendency for a data set. It is calculated by adding up all the values in the data set and dividing the total by the number of values. This gives the average value of the data set. The arithmetic mean is the most used and easily understood measure of central tendency in statistics. The formula for calculating the arithmetic mean for a data set 𝑥 = 𝑥ଵ, … 𝑥n
𝐺𝑇𝐼𝑉𝐸𝑅𝐴𝐸𝑀𝐴𝑉𝐺 is the result of the GTIVERAEMAVG calculation.
𝑋𝐴ሜ𝑣𝑒𝑟𝑎𝑔𝑒 is a function that calculates the moving average of a data series over a specified number of
periods.
𝐶 is the current close price.
𝑅𝑒𝑙𝑎𝑡𝑖𝑣e A𝑑𝑗𝑢𝑠𝑡𝑚𝑒𝑛𝑡is a variable that accumulates the Volatility explosion between the current open price
and the previous close price.
The VERA adjustment factor is calculated as follows:
𝑖𝑓ቀ(𝑋𝐴ሜ𝑣𝑒𝑟𝑎𝑔𝑒(𝐴𝑇𝑅, 𝒙)[0] > 𝑉𝑜𝑙𝑎𝑡𝑅𝑒𝑙𝑎𝑡𝑖𝑣𝑒[0])𝑜𝑟𝑑𝑎𝑡𝑒[0]ቁ ≠ 𝑑𝑎𝑡𝑒[1]𝑡ℎ𝑒𝑛
𝒃𝒆𝒈𝒊𝒏
𝑉𝐸𝑅𝐴 = 1 ∗ 𝑂 − 𝐶[1];
𝑅𝑒𝑙𝑎𝑡𝑖𝑣𝑒 A𝑑𝑗𝑢𝑠𝑡𝑚𝑒𝑛𝑡= 𝑅𝑒𝑙𝑎𝑡𝑖𝑣𝑒 A𝑑𝑗𝑢𝑠𝑡𝑚𝑒𝑛𝑡+ 𝑉𝐸𝑅𝐴;
𝒆𝒏𝒅;
Another important consideration when applying the VERA theory is the need to have a clear understanding of the underlying asset being traded. Different asset classes, such as stocks, bonds, commodities, and currencies, can exhibit different levels of volatility and can be influenced by different factors. It is important for traders and investors to have a thorough understanding of the characteristics and drivers of the asset they are trading to anticipate market movements more accurately and apply the VERA theory effectively.


